Columbia University
Irving Medical Center
Neurological Institute
710 West 168th Street, 3rd floor
(212) 305-1818
TaubCONNECT Research Perspective:
October 2024
2: Alzheimer's Disease CSF Biomarkers Correlate with Early Pathology and Alterations in Neuronal and Glial Gene Expression
3: A Cross-Disease Resource of Living Human Microglia Identifies Disease-Enriched Subsets and Tool Compounds Recapitulating Microglial States
Cellular Communities Reveal Trajectories of Brain Ageing and Alzheimer's Disease
 |
 |
| Vilas Menon, PhD | Philip L. De Jager, MD, PhD |
Recent advances in molecular profiling have transformed our understanding of the aging human brain, particularly in Alzheimerâs disease (AD). Traditional bulk tissue analyses of brain autopsies have offered molecular insights but miss the cellular complexity of the brain. With single-cell and single-nucleus RNA sequencing, researchers can now observe AD-related changes within specific cell types, such as neurons, glial cells, and vascular cells. However, distinguishing AD-associated changes from normal aging processes and mapping the sequence of these changes remains challenging, particularly when relying on autopsy data from advanced stages of AD.

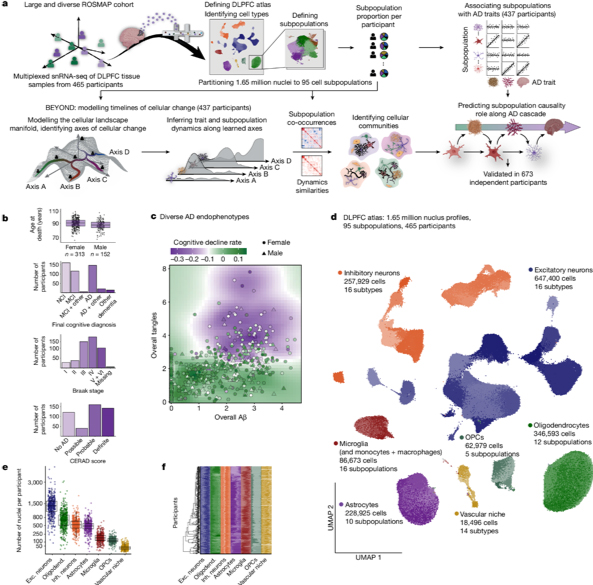
Figure 1. a, Overview of the experimental and analytic steps. b,c, Clinicopathologic characteristics of the 465 ROSMAP participants. b, Participantsâ age of death, final cognitive diagnosis and distribution of pathologic hallmarks of AD, Aβ (CERAD score) and tau (Braak score) (Methods). Additional details are provided in Supplementary Table 1. c, The load of Aβ pathology (x axis) compared to the load of tau pathology (y axis) among participants. Dots and triangles indicate female and male participants, respectively, coloured by their rate of cognitive decline. d, The ageing-DLPFC atlas. UMAP embedding of 1,649,672 single-nucleus RNA profiles from the DLPFC of participants. Major cell types are noted; shades highlight some of the 95 different cell subpopulations. e, The atlas scale. The number of nuclei per cell type in each participant is shown. Dots represent individual participants (nâ=â465 per cell type). Additional quality-control graphs are shown in Extended Data Fig. 1. Exc., excitatory; inh., inhibitory; oligodend., oligodendrocytes. f, Cellular diversity. The proportions of cell subpopulations across participants are shown. The stacked bar plots show cell subpopulation proportions per participant within each major cell type, colour coded by cell type and shaded by subpopulations. For the box plots in b and e, the box limits show the first and third quartiles, the centre line shows the median value, and the whiskers extend to the highest and lowest values within 1.5Ă the distance between the quartiles.
To address this, in collaboration with Drs. David Bennett and Naomi Habib, we analyzed a diverse set of brain samples from the Religious Orders Study and the Rush Memory and Aging Project (ROSMAP), which includes both AD and non-AD aging brains. As recently reported in Nature, using RNA profiles from 1.65 million nuclei in the prefrontal cortex of 437 participants, our team built a cellular atlas of brain aging and devised a computational workflow, BEYOND, to map cellular changes along two aging pathways: one leading to AD and another to alternative aging. Within the AD pathway, we identified key microglial and astrocytic subpopulations involved in different stages of disease progression, from amyloid buildup to tau pathology and cognitive decline. As highlighted in the CUIMC Newsroom, this atlas not only sheds light on cellular dynamics in aging but also highlights stage-specific therapeutic targets for AD, potentially guiding future treatments.
Vilas Menon, PhD
Assistant Professor of Neurological Sciences (in Neurology and the Taub Institute)
vm2545@cumc.columbia.edu
Philip L. De Jager, MD, PhD
Weil-Granat Professor of Neurology (in Neurology and the Taub Institute)
pld2115@cumc.columbia.edu
 |  | |
| Guy M. McKhann II, MD | Andrew F. Teich, MD, PhD |
Normal Pressure Hydrocephalus (NPH) patients undergoing cortical shunting frequently show early Alzheimer's Disease (AD) pathology on cortical biopsy, providing a unique cohort to study early AD-related changes in brain and cerebrospinal fluid (CSF). In collaboration with Dr. Guy McKhann (Columbia Neurological Surgery), our latest study by Ropri et al. analyzed samples from this patient cohort to investigate the relationship between early AD pathology and various biomarkers.
As recently reported in Alzheimerâs & Dementia, our findings reveal significant correlations between AD pathology in biopsies and CSF biomarkers, specifically CSF β-amyloid-42/40, neurofilament light chain (NfL), and phospho-tau-181 (p-tau181)/β-amyloid-42 ratios. Additionally, we found that certain gene expression modules are associated with elevated NfL levels. Proteomic analysis indicates distinct relationships between CSF proteins and biopsy pathology, highlighting three neuronal proteins (NPTXR, SCG2, and VGF) that decrease in CSF as brain neuronal gene expression declines.
|
Figure 1. Study overview and review of cohort biopsy data. (A) Schematic for the NPH study in this paper (see text for details). (B) Our four modules correlate with quantified βâamyloid and tau pathology on the 81 biopsies with CSF similarly to the correlations reported in ref. [10]. For this study, we also added quantified GFAP staining, and correlations with the four modules are shown (* = FDR adjusted pâvalue < 0.05, see Table S5 for numbers used in this figure). (C) Schematic for our filtering of proteins for proteomic analysis. We selected proteins that passed an FDR of 0.05 in at least one previously published study and trended in the same direction (i.e., up or down in AD) with an unadjusted pâvalue of 0.05 in at least one other study, and which also correlated with one of our pathology variables or gene expression modules with an unadjusted pâvalue of 0.05. (See the Methods section for all details of our filtering steps, cohorts labeled using names assigned in ref. [24]). AD, Alzheimer's disease; NPH, normal pressure hydrocephalus.
|
Notably, the CSF inflammatory marker YKL-40 does not correlate directly with AD pathology but instead aligns with gene expression modules related to astrocyte and microglial responses, which are implicated in neurodegeneration. This suggests that YKL-40, secreted by astrocytes and modulated by activated microglia, could serve as a marker of astrocyte-microglial interactions in AD. Correlations observed between astrocytic and microglial gene expression modules further support this hypothesis.
In conclusion, this study demonstrates, for the first time, how CNS transcriptomic changes associated with early AD pathology correspond with CSF biomarkers. As targeted therapies for AD advance, these biomarkers hold potential to monitor specific pathological processes such as synaptic dysfunction and immune responses. Future research can leverage these findings to investigate AD pathology in model systems and refine biomarkers for clinical applications.
Andrew F. Teich, MD, PhD
Associate Professor of Pathology and Cell Biology (in Neurology)
aft25@cumc.columbia.edu
 |  |  | ||
| Marta Olah, PhD | Vilas Menon, PhD | Philip L. De Jager, MD, PhD |
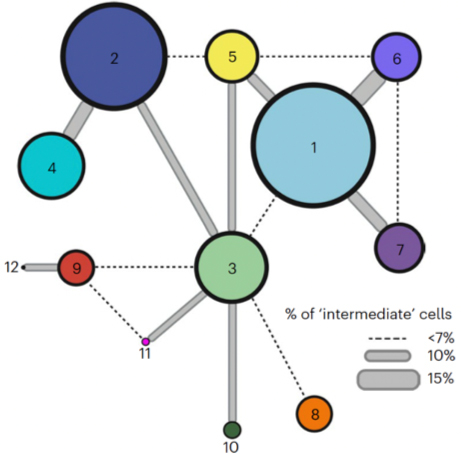
Microglia, the primary immune cells of the central nervous system (CNS), play crucial roles in development, immune defense, and neurological diseases such as Alzheimerâs and multiple sclerosis. Although recent research has revealed the complexity of microglia in humans, most studies have been conducted in mice or limited human samples, often using single-nucleus profiling, which may underrepresent certain gene expressions. This study by our CTCN team, including Drs. Tuddenha, Taga, and Haage (not pictured), aimed to create a comprehensive reference of microglial states across neurodegenerative conditions by analyzing 215,680 live microglia from 74 donors, encompassing various neurological conditions and regions of the CNS. Using enzyme-free dissociation methods, we purified and sequenced single microglial cells, identifying 12 subpopulations that span different CNS regions and disease states (see figure).
As recently reported in Nature Neuroscience, our findings suggest that microglia can transition between functional states based on environmental factors, with distinct metabolic shifts and immune activation signatures. We developed a staining protocol to locate these microglial subsets within tissue samples and confirmed subset-specific markers using the MERFISH method. Additionally, we compared our findings to microglial model systems derived from induced pluripotent stem cells, highlighting differences in microglial diversity. By applying the Connectivity Map (CMAP), we identified potential compounds to selectively influence microglial states, confirming these effects through in vitro analysis. This study provides a valuable resource for understanding microglial heterogeneity and a toolkit for assessing and modulating microglial behavior, offering insights that could enhance therapeutic strategies for CNS diseases.
Philip L. De Jager, MD, PhD
Weil-Granat Professor of Neurology (in Neurology and the Taub Institute)
pld2115@cumc.columbia.edu


